Practice Problems: Statistics, Hypothesis Testing and Visualization

Novel Python solutions to end-of-chapter statistics problems from the 4th Ed. of ‘Medical Statistics’ from Campbell, Machin, and Walters.

Data Enthusiast

Novel Python solutions to end-of-chapter statistics problems from the 4th Ed. of ‘Medical Statistics’ from Campbell, Machin, and Walters.
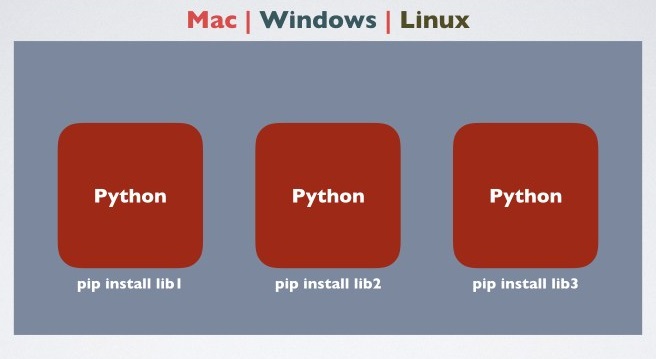
Manage multiple environments in one place.
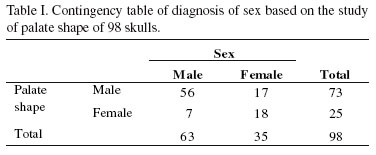
Medical Statistics: Scripted

Running Wild
The Great Decider.

It’s Electric!

The Nernst Equation - Single Ion Species

Create interactive web visualizations, without JavaScript

Data Voodoo

Can data about workplace absenteeism allow us to predict which employees are smokers? We’re about to find out.

It’s Getting Hot In Here.

Enter Letters, Get Lucky

Uh oh.

Test your plot in every style.

A classic model of exponential growth

Pattern Matching

Gratuity Optional?

Words matter.

We’ve talked about AB testing in an earlier post, now is the time to give a full-spectrum run through a real dataset courtesy
of DataCamp.

Where to rent, and where to avoid, if you’ll be visiting Seattle.

Cryptocurrencies: A Digital Goldrush?

Controlled experiments are the beating heart of scientific inquiry, good science is also crucial for understanding your business.

Before you go data spelunking, you need to do your homework!
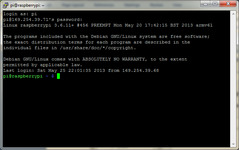
You’ll need the shell. Here’s enough to make you useful.

It’s hot, it’s trendy, it’s powerful. Let’s dive in together using Python.

Your data will be good to you, if you’re good to it. Be responsible, use Pandas.

Scikit-Learn is an essential tool for machine learning with Python

NumPy is a robust scientific computing library for use with the Python language.
Dictionaries are useful for easy access to key:value pairs.
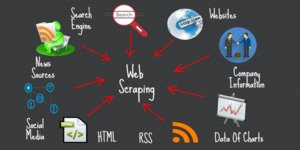
So, you want to grab data from a website, but there’s no API to connect to?

Now that you understand the Pearson test, let’s start working towards a real world example. But first…

Let’s talk about correlation.
In part two of this introduction to ggplot(), we’re going to use Python and Pandas to generate
a dataframe, create a .csv file from that dataframe, and then visualize the data with R.

You have data, how do you visualize it? GGPlot!

Almost anything you need for aggressive data-fu, is ready to go in R.

Hypothesis testing is a powerful methodology for scientists and analysts alike.
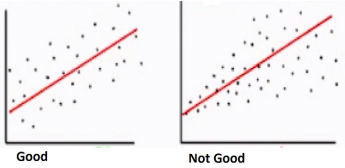
Before you do a t-test, there are factors you need to test. Homogeneity of the variance is one of them.

In college, I read a lot of white papers, A LOT OF THEM. Thankfully, there is a methodology to dissecting the often dense material
that should help you the next time you’re trying to suss out what that darn paper is actually trying to communicate.

Students and professionals everywhere recite the p-value in terms of their data sets, with varying accuracy.