Modeling Membrane Potentials

The Nernst Equation - Single Ion Species
Electrochemical gradients drive countless physiological processes. Let’s focus on one the majority of you will be familiar with, the action potential, a tenet of high school level biology. The standard cell maintains an electrochemical gradient via sodium and potassium ions dissolved in aqueous environments. The best way to remember the model, is to think of a French fry, a potassium rich potato sprinkled with sodium on the outside. This trend remains true in the standard cell. A higher concentration of sodium exists outside the cell, and a higher concentration of Potassium ions inside the cell.
Example: The Action Potential
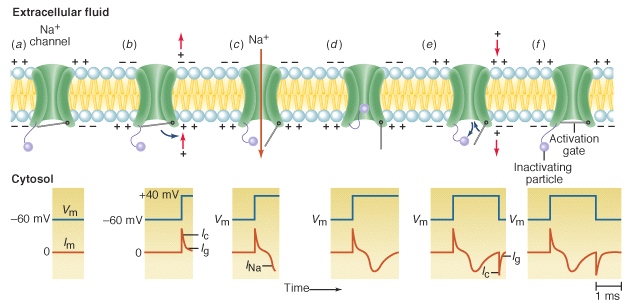
Luigi Galvani first birthed the idea that electricity powers the biological system, and Walther Nernst derived an equation to help describe the basis for the theory. The Nernst equation, allows us to calculate the membrane potential of a given cell, generated by a concentration gradient of ions separated by a membrane permeable only to a specific ion. This permeable membrane was later evidenced in the form of a particular transmembrane protein, the voltage gated sodium channel, and another transmembrane protein called a sodium-potassium pump. Together, they allow differential trafficking of sodium and potassium ions normally pushed away by a structural phospholipid bi-layer with hydrophilic and hydrophobic regions. The net result of this enforced gradient, is part of the biological electricity Galvani first hypothesized.
Coding Cells
Today, we’re going to write a program to calculate the expected membrane potential of a human cell using the Nernst Equation.
Important Caveat
We only use the Nernst equation for single ions, for multiple ions see the Goldman-Hodgkin-Katz equation.
The Basic Model
For our first model, we’ll use the Nernst in it’s raw form, but asking the user to enter all non-constant variables, calculate our potential, and plot our imagined recording.
Import Libraries
import numpy as np
import matplotlib.pyplot as plt
Define Global Constants
Faraday = 96485
R = 8.314
Build a Class
class Nernst():
Define Temperature - Celsius to Kelvin
    def temp(self):
        """
        :args:  none
        :return: Temperature in Kelvins
        """
        C = float(input("Temperature in Celsius"))
        K = C + 273.15
        return K
Define Ionic Charge
    def charge(self):
        """
        :args: none
        :return: charge of ionic species
        """
        v = int(input("Charge"))
        return v
Set Inner Cellular Concentration of Target Ion
    def innerConcentration(self):
        """
        :args: none
        :return: Concentration of ion species inside cellular membrane, in millimolars
        """
        inner = float(input("Inner Concentration (mM)"))
        return inner
Set Outer Cellular Concentration of Target Ion
    def outerConcentration(self):
        """
        :args: none
        :return: Concentration of ion species outside of cellular membrane, in millimolars
        """
        outer = float(input("Outer Concentration (mM)"))
        return outer
Equilibrium Calculation via Applied Nernst Equation
    def equilibrium(self, T, z, Xi, Xo):
        """
        :param T: Temperature in Kelvins
        :param z: Valence of ionic species
        :param Xi: Inner membrane concentration
        :param Xo: Outer membrane concentration
        :return: Membrane potential for single species
        """
        GasIons = (R*T)/(z*Faraday)
        Concentrations = np.log(Xo/Xi)
        membranePotential = GasIons*Concentrations
        return membranePotential
Visualize
    def viz(self, volts):
        plt.scatter([0,1,2,3], [0, 0, volts, volts])
        plt.plot([0,1,2,3], [0, 0, volts, volts])
        plt.ylim(-100,100)
        plt.xlim(0,3)
        xlabs = np.arange(0, 3, 1.0)
        bins = ['','Channel Closed', 'Channel Open','']
        plt.xticks(xlabs, bins)
        plt.text(2, volts+5, str(round(volts, 2)))
        plt.title("Membrane Potential Single Ion Species")
        plt.xlabel("Membrane Permeability")
        plt.ylabel("Voltage (mV)")
        plt.show()
Run It!
if __name__ == "__main__":
    Nernst = Nernst()
    temperature = Nernst.temp()
    charge = Nernst.charge()
    inner = Nernst.innerConcentration()
    outer = Nernst.outerConcentration()
    membrane = Nernst.equilibrium(temperature, charge, inner, outer)
    print("Result: " + str(membrane))
    Nernst.viz(membrane*1000)
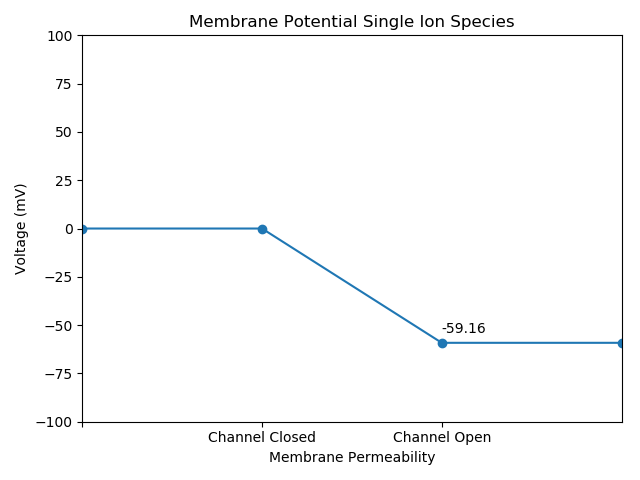
Output
Parameters:
[25 Degrees Celsius, -1 Ionic Charge, 10 mM Inner Concentration, 100 mM Outer Concentration]
Part II - Real Ions
Let’s modify what we have. Rather than prompting the user to enter the attributes, let’s assume there is a file containing the relevant data, where each row contains information unique to a particular chemical ion. We’ll then automate the process, allowing the generation of a new plot for each recorded ion in the dataset. We’ll also augment our global constants to include a standard mammalian temperature already in kelvins. We’ll also set a global constant temperature we can use to standardize our mammalian cell attributes.
Let’s look at the full script:
Specific Ions From A Data File, Separate Plots
import numpy as np
import matplotlib.pyplot as plt
import pandas as pd
# Global Constants
Faraday = 96485
R = 8.314
Temp = 310.15
class Nernst():
def equilibrium(self, T, z, Xi, Xo):
"""
:param T: Temperature in Kelvins
:param z: Valence of ionic species
:param Xi: Inner membrane concentration
:param Xo: Outer membrane concentration
:return: Membrane potential for single species
"""
GasIons = (R*T)/(z*Faraday)
Concentrations = np.log(Xo/Xi)
membranePotential = GasIons*Concentrations
return membranePotential
def viz(self, volts, ion):
plt.scatter([0,1,2,3], [0, 0, volts, volts])
plt.plot([0,1,2,3], [0, 0, volts, volts])
plt.ylim(-100,100)
plt.xlim(0,3)
xlabs = np.arange(0, 3, 1.0)
bins = ['','Channel Closed', 'Channel Open','']
plt.xticks(xlabs, bins)
plt.text(2, volts+5, str(round(volts, 2)))
plt.title("Membrane Potential Single Ion Species: "+str(ion))
plt.xlabel("Membrane Permeability")
plt.ylabel("Voltage (mV)")
plt.show()
if __name__ == "__main__":
file = pd.read_csv('C:\\Users\\ajh\\Desktop\\ions.txt',
names=['name', 'charge', 'temperature', 'inner', 'outer'],
dtype={'name':str, 'charge':int, 'temperature':int, 'inner':int, 'outer':float},
skiprows=1)
df = pd.DataFrame(file)
Nernst = Nernst()
for index,row in file.iterrows():
potential = Nernst.equilibrium(Temp,row.charge,row.inner,row.outer)
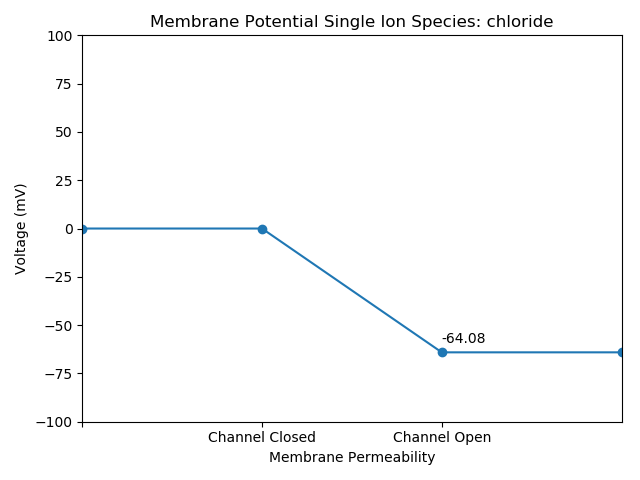
Nernst.viz(potential*1000, df.name[index])
Sodium
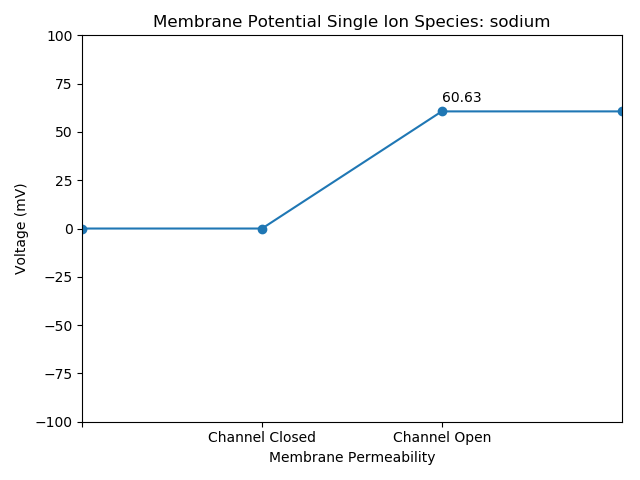
Potassium
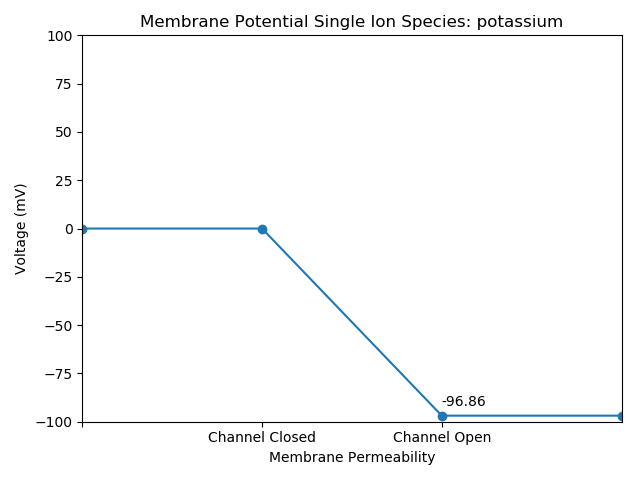
Chloride
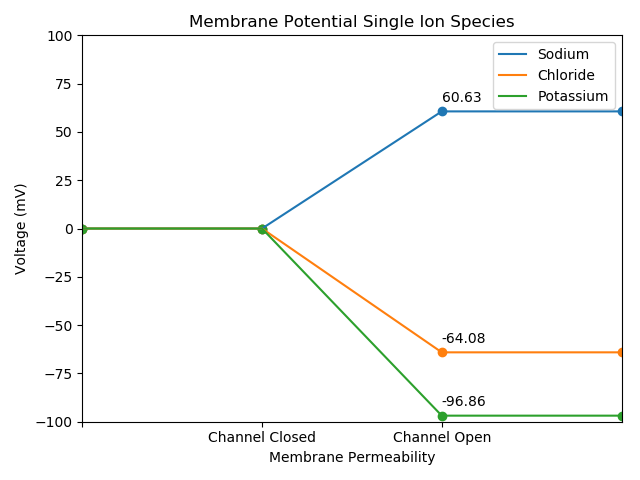
Great! Let’s continue refining our script, and develop a cleaner presentation for our audience. We’re going to plot all recordings onto a single plot with colors and a legend to distinguish our observations.
Specific Ions From A Data File, One Plot
import numpy as np
import matplotlib.pyplot as plt
import pandas as pd

# Global Constants
Faraday = 96485
R = 8.314
Temp = 310.15

class Nernst():

    def equilibrium(self, T, z, Xi, Xo):
        """
        :param T: Temperature in Kelvins
        :param z: Valence of ionic species
        :param Xi: Inner membrane concentration
        :param Xo: Outer membrane concentration
        :return: Membrane potential for single species
        """
        GasIons = (R*T)/(z*Faraday)
        Concentrations = np.log(Xo/Xi)
        membranePotential = GasIons*Concentrations
        return membranePotential
        def viz(self, volts):
        plt.scatter([0,1,2,3], [0, 0, volts, volts])
        plt.plot([0,1,2,3], [0, 0, volts, volts])
        plt.ylim(-100,100)
        plt.xlim(0,3)
        xlabs = np.arange(0, 3, 1.0)
        bins = ['','Channel Closed', 'Channel Open','']
        plt.xticks(xlabs, bins)
        plt.text(2, volts+5, str(round(volts, 2)))
        plt.title("Membrane Potential Single Ion Species")
        plt.xlabel("Membrane Permeability")
        plt.ylabel("Voltage (mV)")
        plt.legend(['Sodium', 'Chloride', 'Potassium'])


if __name__ == "__main__":
    file = pd.read_csv('C:\\Users\\ajh\\Desktop\\ions.txt',
                       names=['name', 'charge', 'temperature', 'inner', 'outer'],
                       dtype={'name':str, 'charge':int, 'temperature':int, 'inner':int, 'outer':float},skiprows=1)

    df = pd.DataFrame(file)
    Nernst = Nernst()
    for index,row in file.iterrows():
        potential = Nernst.equilibrium(Temp,row.charge,row.inner,row.outer)
        Nernst.viz(potential*1000)
    plt.show()
All Ions