Modeling Fibonacci

A classic model of exponential growth
Fibonacci was a smart guy, let’s dig into one of his classic problems.
The Fibonacci sequence is simply a series of numbers in which each number is the sum of the two preceding numbers.
We’ll model this algorithm with python and generate a scatter plot via MatPlotLib.
Import
First, we need to import our libraries, in this case we’ll be using MatPlotLib, and we’ll be setting our style to ggplot.
import matplotlib.pyplot as plt
plt.style.use('ggplot')
Now, we can begin building a class, let’s call it FibonacciScatter.
class FibonacciScatter(object):
Great, now we should work on the guts of the algorithm by building a function we’ll call FibonacciSequence().
Let’s also make it a little more flexible, by creating a parameter ‘length’ which will allow us to control the number of Fibonacci numbers we want to generate at run time.
def FibonacciSequence(self, length):
    """
    :param length:  how many points to calculate
    :return: list of data points
    """
My approach is to first create to variables, called ‘p1’ and ‘p2’, these will store two positions/values of Fibonacci numbers, starting with p1 = 0, and p2 = 1.
p1, p2 = 0, 1
Let’s then create an empty list called ‘fibList’, which I’m sure you’ve guessed, will hold our list of Fibonacci values.
fibList = []
Python for loops are easy and fun, and make this an casual algorithm to generate. Let’s look at the code and then go through each step together.
for each in range(length):
    fibList.append(p1)
    p1, p2 = p2, p1 + p2
return fibList
What this will do, is control each step in our algorithm, allowing us to iterate a number of steps equal to the range of our length. For example, if the user has set ‘length = 10’, then we will generate 10 datapoints, because we’ve walked through our steps 10 times.
Let’s check our output to make sure we’re on the right track, we’ll do this by creating a list of the first 10 numbers in the solved Fibonacci sequence, and testing that our output is equal.
class FibonacciScatter(object):
    def FibonacciSequence(self, length):
        """
        :param length:  how many points to calculate
        :return: list of data points
        """
        p1, p2 = 0, 1
        fibList = []
        for each in range(length):
            p1, p2 = p2, p1 + p2
            fibList.append(p1)
            print(p1)
        return fibList

if __name__ == "__main__":
    x = FibonacciScatter()
    data = x.FibonacciSequence(10)
    validFibonacci = [0, 1, 1, 2, 3, 5, 8, 13, 21, 34]
    print(validFibonacci)
    print(data == validFibonacci)
Result:
[0, 1, 1, 2, 3, 5, 8, 13, 21, 34]
True
Ok, it looks like we did it. Let’s now take a visual approach, let’s follow through on our plan to generate a plot.
Let’s call our next method ‘ScatterSequence’, which accepts a parameter ‘seq’.
def ScatterSequence(self, seq):
    """
    :param seq: List of fibonacci data points
    :return: No return, generates scatter plot with trendline
    """
Now the guts.
Let’s create two empty lists, x and y.
x = []
y = []
Once again, let’s use a for loop, but this time, instead of controlling the number of steps based on a range, let’s use enumerate on our ‘seq’. With each pass, we’ll append the index position into x, and the value into y.
for position, value in enumerate(seq):
    x.append(position)
    y.append(value)
Our X and Y lists should be populated, let’s go ahead and start building a scatter plot.
plt.scatter(x, y)
Let’s set a title and label our axes…
plt.title("Fibonacci Sequence")
plt.xlabel("X")
plt.ylabel("Y")
plt.tight_layout()
plt.show()
That should be enough! Let’s go ahead and look at a unified view of our code for the plotting method.
def ScatterSequence(self, seq):
    """
    :param seq: List of fibonacci data points
    :return: No return, generates scatter plot with trendline
    """
    x = []
    y = []
    for position, value in enumerate(seq):
        x.append(position)
        y.append(value)
    plt.scatter(x, y)
    plt.title("Fibonacci Sequence")
    plt.xlabel("X")
    plt.ylabel("Y")
    plt.tight_layout()
    plt.show()
To run this bad boy, we’ll create an instance of FibonacciScatter() and walk through our methods.
if __name__ == "__main__":
    x = FibonacciScatter()
    data = x.FibonacciSequence(10)
    x.ScatterSequence(data)
And our output…
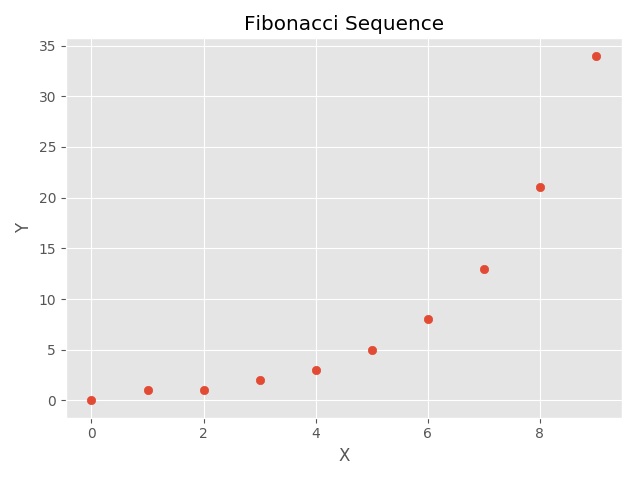
Cool, that’s it!
Let’s review all the steps involved:
import matplotlib.pyplot as plt
import numpy as np
plt.style.use('ggplot')

class FibonacciScatter(object):

    def FibonacciSequence(self, length):
        """
        :param length:  how many points to calculate
        :return: list of data points
        """
        p1, p2 = 0, 1
        fibList = []
        for each in range(length):
            fibList.append(p1)
            p1,p2 = p2, p1+p2
        return fibList

    def ScatterSequence(self, seq):
    """
    :param seq: List of fibonacci data points
    :return: No return, generates scatter plot with trendline
    """
        x = []
        y = []
        for position, value in enumerate(seq):
            x.append(position)
            y.append(value)
        plt.scatter(x, y)
        plt.title("Fibonacci Sequence")
        plt.xlabel("X")
        plt.ylabel("Y")
        plt.tight_layout()
        plt.show()

if __name__ == "__main__":
    x = FibonacciScatter()
    data = x.FibonacciSequence(10)
    x.ScatterSequence(data)