Hypothesis Testing - A Primer

Hypothesis testing is a powerful methodology for scientists and analysts alike.
Thankfully, it is a fairly straightforward endeavor, which I’ve outlined below.
| Hypothesis Testing - Main Steps |
|---|
| (A)Declare your null hypothesis (Ho) |
| (B)Declare your alternative hypothesis (Ha) |
| (C)State your assumptions about your dataset |
| (D)Set your significance level(alpha α) for your assay |
| (E)Choose your test and Conduct your experiment |
| (F)Record observations/results |
| (G)Compute probability of your results |
| (H)Make a decision based on your p-value |
Here’s a practical example using R:
A new weight loss drug introduced by a British pharmaceutical company claims that, individuals who are clinically diagnosed as obese, will lose 10% of their body weight by taking two pills of this drug a day for 30 days (without changing their lifestyle). Prior to approving this drug for US consumers, FDA wanted to test the potency of the drug. A clinical trial was conducted with a population of 20 obese individuals, treated with this drug for 30 days.
Weightloss.csv
| ID | Start Weight | Final Weight |
|---|---|---|
| 1 | 321 | 300 |
| 2 | 300 | 295 |
| 3 | 350 | 345 |
| 4 | 360 | 300 |
| 5 | 400 | 350 |
| 6 | 250 | 200 |
| 7 | 281 | 270 |
| 8 | 278 | 274 |
| 9 | 330 | 350 |
| 10 | 374 | 320 |
| 11 | 280 | 250 |
| 12 | 421 | 400 |
| 13 | 245 | 245 |
| 14 | 352 | 325 |
| 15 | 312 | 300 |
| 16 | 279 | 270 |
| 17 | 233 | 230 |
| 18 | 310 | 300 |
| 19 | 265 | 280 |
| 20 | 275 | 250 |
(A)
Null Hypothesis:
Our null hypothesis is that clinically obese patients following the suggested protocol will not lose 10% of their starting weights.
Ho : Weight Lost != 10%
(B)
Alternative Hypothesis:
Our alternative hypothesis is that clinically obese patients following the suggested protocol will lose 10% of their starting weights.
Ha : Weight Lost = 10%
Interpretation Conditions:
Ho : Mu != 10%
Ha : Mu = 10%
(C)
Assumptions
We assumed that our data is continuous, that our group is the result of random sampling, that the participants adhered to the protocols of the study, and that our data is based on a normal distribution.
(D)
Significance
An alpha level of 0.05 was selected for this analysis.
(E)
Test
Our analysis relies on utilizing the T-Statistic, where:
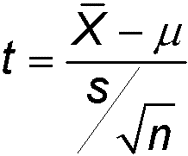
CODE SOLUTION
WeightLoss <- read.csv("https://s3.amazonaws.com/MyData_assets/WeightLoss.csv")
WeightLoss <- startweight - finalweight
samplePercentChange <- WeightLoss/startweight
sampleChangeMean <- mean(percentChange)
tenPercent ← 0.10
sdSamples <- sd(samplePercentChange)
T = ( sampleChangeMean – tenPercent ) / ( sqrt(sdSamples) / sqrt(20) )
     = -0.7636174
T-Crit = 2.093
p-value = .454484
p-value > 0.05, not significant
Based on our calculated p-value, we fail to reject our null hypothesis. We can conclude that when following the protocol, and ingesting 2 pills every day for 30 days, clinically obese patients do not achieve a loss of weight equal to 10% of their starting weights under this experimental condition