Machine Learning: Predicting Labels Using a KNN Algorithm

Can data about workplace absenteeism allow us to predict which employees are smokers? We’re about to find out.
Today, we’ll use a K-Nearest Neighbors Classification algorithm to see if it’s possible.
We’ll be using data found here to test our algorithm.
Let’s get started.
Overview
The k-NN algorithm is a supervised learning technique in classification problems. Our goal is to predict a label by developing a generalized model we can apply to previously unseen data.
Key Steps:
- Extract features and labels
features = df.drop('label', axis=1) labels = df[label] - Split data into test and train datasets using test_train_split
X_train, X_test, y_train, y_test = train_test_split(features, label, test_size, random state, stratify = target_labels) - Fit/Train data using knn classifier on training set
knn.fit(training_features, training_labels) - Predict on labeled test set
knn.predict(test features) - Compare prediction w/ known labels
y_pred = knn.predict(X_test) - Metric: Accuracy = Fraction Correct Predictions, SciKitLearn’s
scoremodule
print(knn.score(test features, test labels)) - Tune Hyperparameters: # of neighbors used
Importing Our Toolkit
We’ll be using a variety of libraries, so let’s get briefly familiarized with some common tools of the trade.
from sklearn.model_selection import train_test_split
from sklearn.neighbors import KNeighborsClassifier
import pandas as pd
import numpy as np
import matplotlib.pyplot as plt
Retrieving Data
The link above will send you to a .zip data set, so let’s grab it, unpack it, and load it using the following method.
def loadFile(path):
    #Load Excel File into Pandas DataFrame
    df = pd.read_excel(path)
    return df
I have it stored locally on my desktop, and I’ve passed the excel file to loadFile() as the path argument. This will return a Pandas DataFrame for us to work with.
Let’s check it out!
Exploratory Data Analysis
As always, we want to get very well acquainted with our new bundle of data joy. We want to see what kind of features we are working with, check data types, and look for missing values in our records. We’ll use shape, info(), and columns to begin understanding the contents of our DataFrame.
def minorEDA(df):
    """
    Generates a preliminary EDA Analysis of our file

    args: df - DataFrame of our excel file
    returns: None
    """

    lineBreak = '------------------'

    #Check Shape
    print(lineBreak*3)
    print("Shape:")
    print(df.shape)
    print(lineBreak*3)
    #Check Feature Names
    print("Column Names")
    print(df.columns)
    print(lineBreak*3)
    #Check types, missing, memory
    print("Data Types, Missing Data, Memory")
    print(df.info())
    print(lineBreak*3)
This will generate a quick report for us to view, with a generated line break to easily separate each element of the report.
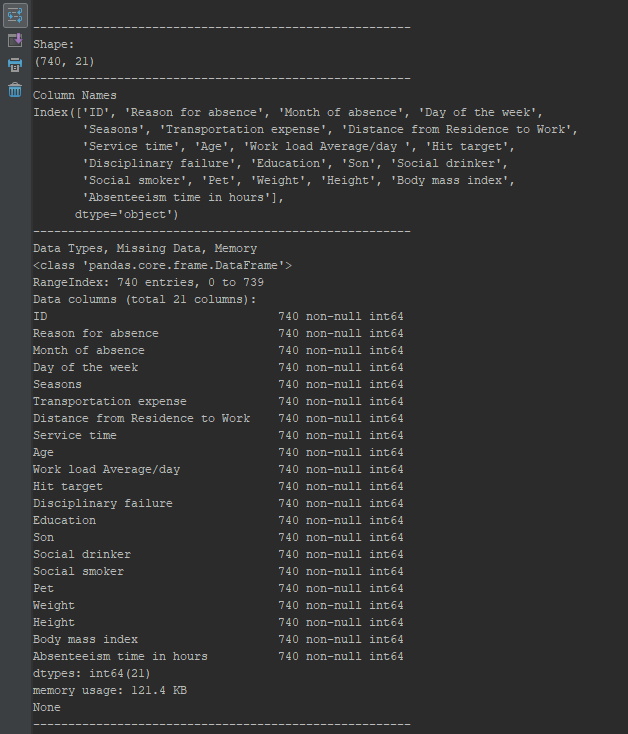
Shape
We have a total of 21 columns, and 740 observations.
Lot’s to work with here!
Columns
As you can see, we have some interesting records that may allow us to make predictions about the employees. However, we’re only interested in predicting the classification of ‘Social smoker’ from the rest of our information.
Info
Finally, we can see that our dataset is entirely comprised of int64 values, and none are missing. We won’t need to clean too much to get started.
Selecting Features
Here is a simple method to input a desired column name and a related dataset.
As a first step towards our algorithm, let’s extract columns from our dataframe and store them as ‘x’ and ‘y’. We are trying to predict ‘y’ given ‘x’, so let’s simply extract our target as y, and then drop it from the dataframe and retain the rest of the features in ‘x’.
def feature(col, df):
"""
args: col - Name of column you want to predict
      df  - Dataset you're working with
return: Extracted column sets x, y
"""
    # Create arrays for the features and the response variable
    y = df[feature]
    x = df.drop(feature, axis=1)
    return x, y
Baseline Prediction Score
Before we get too deep into our process, let’s see if this seems like a promising label to predict from our features. We’ll do minimal prep work and see what kind of accuracy score we can generate with our base conditions.
Let’s first break our data into test and train groups, with a test size of 20%
We’ll then build a KNN classifier and fit our X & Y training data, then check our prediction accuracy using knn.score() by specifying our X & Y test groups.
def TestTrainFitPlot(x, y):

    # Split into training and test set
    X_train, X_test, y_train, y_test = train_test_split(X, y, test_size = 0.20,
                                                    random_state=1, stratify=y)

    # Build knn classifier
    knn = KNeighborsClassifier()

    # Fit training data
    knn.fit(X_train, y_train)

    #Cneck Accuracy Score
    print('Default Accuracy: {}'.format(round(knn.score(X_test, y_test), 3)))

With no manipulation, we’ve achieved a 91.2% accuracy score at predicting a label for smoker status given our full feature set. Interesting, it seems there might be some value here.
It’s not bad! But, can we do better?
Let’s give it a shot. We didn’t define the number of neighbors to be used in our model, instead relying on the default value of 5. This is actually close to the recommended value found from finding the square root of the number of features, but let’s go ahead and test a few values.
We’ll create empty arrays to catch results from a variety of the n_neighbors parameter for KNeighborsClassifier(), ranging from 1-9.
# Catching test/train accuracy results
nums = np.arange(1, 10)
train_accuracy = np.empty(len(nums))
test_accuracy = np.empty(len(nums))

# Enum Loop, accuracy results using range on 'n' values for KNN Classifier
for acc, n in enumerate(nums):
    # Try KNeighbors with each of 'n' neighbors
    knn = KNeighborsClassifier(n_neighbors=n)

    # Fitting
    knn.fit(X_train, y_train)

    # Training Accuracy
    train_accuracy[acc] = knn.score(X_train, y_train)

    # Testing Accuracy
    test_accuracy[acc] = knn.score(X_test, y_test)
To make this easy, let’s plot the results so we can visualize the accuracy scores quickly. We’ll plot the test and train accuracy scores, and append values to our test results for an easy assay. We’ll use ‘ggplot’ style, and try to format a clean output using labels, rotations, and labelpadding.
#Plotting

#set plot style
plt.style.use('ggplot')
#Set Main Title
plt.title('KNN Neighbors')
#Set X-Axis Label
plt.xlabel('Neighbors\n(#)')
#Set Y-Axis Label
plt.ylabel('Accuracy\n(%)', rotation=0, labelpad=35)
#Place Testing Accuracy
plt.plot(neighbors, test_accuracy, label='Testing Accuracy')
#Place Training Accuracy
plt.plot(neighbors, train_accuracy, label='Training Accuracy')
#Append Labels on Testing Accuracy
for a,b in zip(neighbors, test_accuracy):
    plt.text(a, b, str(round(b,2)))
#Add Legend
plt.legend()
#Generate Plot
plt.show()
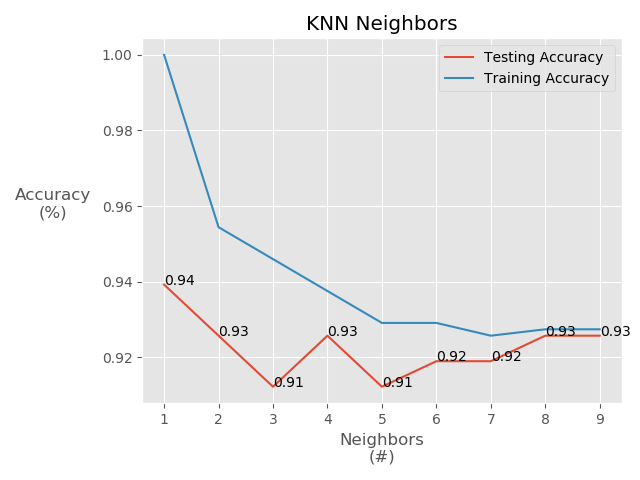
It looks like we could do slightly better by specifying n_neighbors = 4, but only marginally so. In either case, a labeling accuracy of 91-93% is interesting right?
Full Code
from sklearn.model_selection import train_test_split
from sklearn.neighbors import KNeighborsClassifier
import pandas as pd
import numpy as np
import matplotlib.pyplot as plt
#set plot style
plt.style.use('ggplot')

def loadFile(path):
    #Load Excel File into Pandas DataFrame
    df = pd.read_excel(path)
    return df

def minorEDA(df):
    lineBreak = '------------------'

    #Check Shape
    print(lineBreak*3)
    print("Shape:")
    print(df.shape)
    print(lineBreak*3)
    #Check Feature Names
    print("Column Names")
    print(df.columns)
    print(lineBreak*3)
    #Check types, missing, memory
    print("Data Types, Missing Data, Memory")
    print(df.info())
    print(lineBreak*3)

def feature(feature, df):
    # Create arrays for the features and the response variable
    y = df[feature]
    x = df.drop(feature, axis=1)
    return x, y

def TestTrainFitPlot(X, y):
    # Setup arrays to store train and test accuracies
    neighbors = np.arange(1, 20)
    train_accuracy = np.empty(len(neighbors))
    test_accuracy = np.empty(len(neighbors))

    # Split into training and test set
    X_train, X_test, y_train, y_test = train_test_split(X, y, test_size = 0.20, random_state=42, stratify=y)

    # Try KNN with 5 neighbors
    knn = KNeighborsClassifier()

    # Fit training data
    knn.fit(X_train, y_train)

    #Cneck Accuracy Score
    print('Default Accuracy: {}'.format(round(knn.score(X_test, y_test), 3)))
    # Enum Loop, accuracy results using range on 'n' values for KNN Classifier
    for acc, n in enumerate(neighbors):
        # Try KNeighbors with each of 'n' neighbors
        knn = KNeighborsClassifier(n_neighbors=n)

        # Fitting
        knn.fit(X_train, y_train)

        # Training Accuracy
        train_accuracy[acc] = knn.score(X_train, y_train)

        # Testing Accuracy
        test_accuracy[acc] = knn.score(X_test, y_test)

    #Plotting
    #Set Main Title
    plt.title('KNN Neighbors')
    #Set X-Axis Label
    plt.xlabel('Neighbors\n(#)')
    #Set Y-Axis Label
    plt.ylabel('Accuracy\n(%)', rotation=0, labelpad=35)
    #Place Testing Accuracy
    plt.plot(neighbors, test_accuracy, label='Testing Accuracy')
    #Place Training Accuracy
    plt.plot(neighbors, train_accuracy, label='Training Accuracy')
    #Append Labels on Testing Accuracy
    for a,b in zip(neighbors, test_accuracy):
        plt.text(a, b, str(round(b,2)))
    #Add Legend
    plt.legend()
    #Generate Plot
    plt.show()

if __name__ == '__main__':
    df = loadFile('...Desktop\\Absenteeism_at_work.xls')
    minorEDA(df)
    x, y = feature('Social smoker', df)
    TestTrainFitPlot(x, y)