Streamlining Contingency Tables
Medical Statistics: Scripted
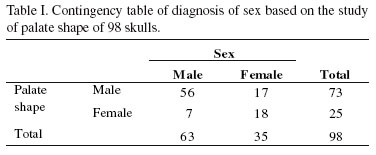
Contingency Table
A contingency table is a matrix formatted view of the frequency distribution of given variables.
2x2 Contingency Table
"""
Example Contingency Table:
---------------------------------
Outcome      Treatment Groups
_________________________________
            Test        Control
Positive     a             c
Negative     b             d
Total       a+b           c+d
---------------------------------
Key:
a = t_pos
b = t_neg
c = c_pos
d = c_neg
"""
Libraries
import pandas as pd
import numpy as np
import matplotlib.pyplot as plt
Proportion of positive outcomes under test condition
Used for treatment comparison to control
def p_test_subs(t_pos, t_neg):
    """
    Calculate proportion of positive outcomes under test condition
    :param t_pos: Positive results in Test group
    :param t_neg: Negative results in Test group
    :return p_test: Proportion of subjects w/ positive outcome under treatment/test condition
    """
    total = t_pos+t_neg
    p_test = t_pos/total
    return p_test
Proportion of positive outcomes under control condition
Used for treatment comparison to control
def p_control_subs(c_pos, c_neg):
    """
    Calculate proportion of positive outcomes under control condition
    :param c_pos: Positive results in Control group
    :param c_neg: Negative results in Control group
    :return p_control: Proportion of subjects w/ positive outcome under control condition
    """
    total = c_pos+c_neg
    p_control = c_pos/total
    return p_control
Basic difference of proportions of positive results in test, control groups
def diff_proportions(p_test, p_control):
    """
    Calculate difference of proportions of positive results in test, control groups
    :param p_test: Proportion of positive outcome under test
    :param p_control: Proportion of positive outcome under control
    :return dop: Difference of proportions of p_test and p_control
    """
    dop = p_control - p_test
    return dop
Absolute risk difference of positive results in test, control groups
Used for clinical trials
def diff_proportions(p_test, p_control):
    """
    Calculate Absolute risk difference (ARD) of positive results in test, control groups
    :param p_test: Proportion of positive outcome under test
    :param p_control: Proportion of positive outcome under control
    :return ard: Absolute risk difference
    """
    ard = np.abs(p_control - p_test)
    return ard
Relative Risk
Used for prospective studies
def relative_risk(p_test, p_control):
    """
    Calculates relative risk
    :param p_test: Proportion of positive outcome under test
    :param p_control: Proportion of positive outcome under control
    :return rr: Relative Risk(RR)
    """
    rr = p_test/p_control
    return rr
Number needed to treat/harm (NNT)
Inverse of RR
def NNT(p_test, p_control):
    """
    Calculate Number needed to treat (NNT) of positive results in test, control groups
    :param p_test: Proportion of positive outcome under test
    :param p_control: Proportion of positive outcome under control
    :return nnt: number needed to treat
    """
    nnt = 1 / np.abs(p_test - p_control)
    return nnt
Odds Ratio (OR)
Ratio of occurences/non-occurence between test/control groups
def OddsRatio(p_test, p_control):
    """
    Calculates odds ratio
    :param p_test: Proportion of positive outcome under test
    :param p_control: Proportion of positive outcome under control
    :return odds_ratio: Ratio of odds of occurence/non-occurence for test and control groups
    """
    test_group = p_test/(1-p_test)
    control_group = p_control/(1-p_control)
    odds_ratio = test_group/control_group
    return odds_ratio
Written on November 1, 2018